NRR Calculator
Net revenue retention measures how much recurring revenue you keep from the customers you already had, once expansion, contraction and churn are counted. Enter one period of MRR movements to get NRR, GRR, and the gap expansion has to fill.
Calculate your net revenue retention
Net revenue retention formula and a worked example
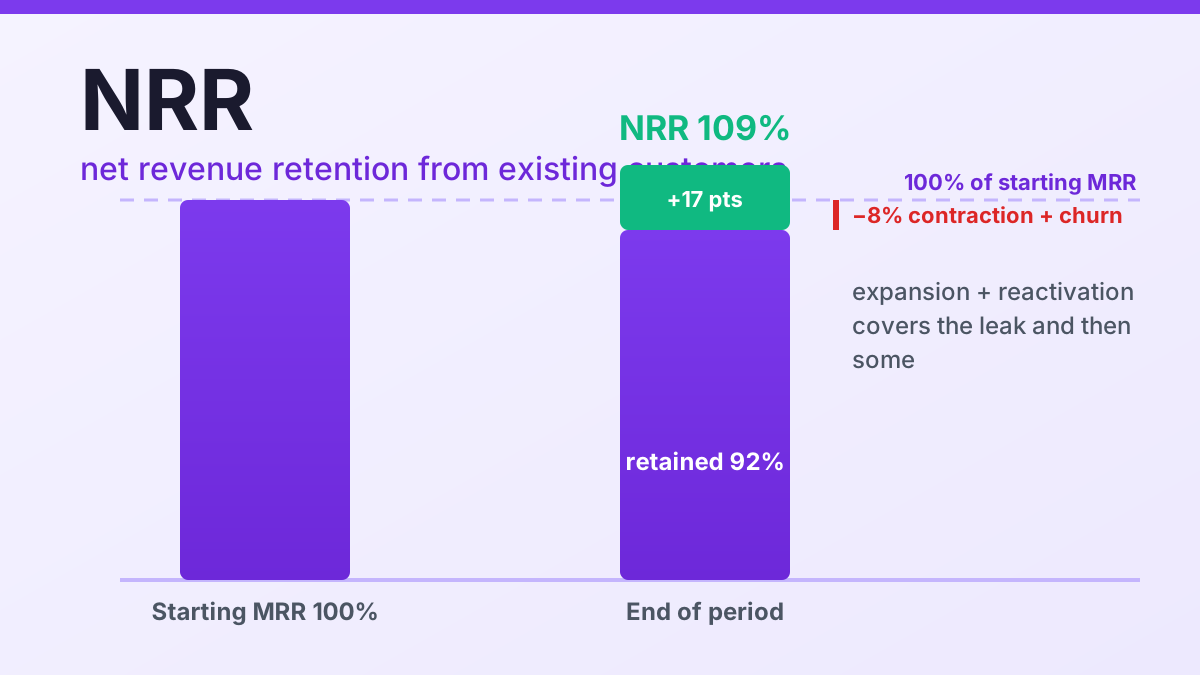
The net revenue retention formula is (starting MRR + expansion + reactivation − contraction − churn) ÷ starting MRR × 100. Take a cohort that started the month at $100,000 MRR. It added $15,000 from upgrades, won back $2,000 from returning customers, lost $3,000 to downgrades and $5,000 to cancellations. That leaves $109,000, so NRR = ($100,000 + $15,000 + $2,000 − $3,000 − $5,000) ÷ $100,000 × 100 = 109%.
Only customers who were already paying at the start of the period count. New logos are excluded by definition, and that exclusion is what makes the metric a clean read on product and pricing power rather than on sales capacity: a team that lives on new business can show solid MRR growth and a sinking NRR at the same time.
The net revenue retention calculator above applies the same arithmetic to any window you pick — a month, a quarter, or a rolling twelve months — and reports the gross retention floor underneath the headline.
NRR benchmarks in 2026
What is a good net revenue retention rate in 2026? The honest answer starts with the segment, because published medians differ by more than 40 points between consumer products and public enterprise software.
| Benchmark | NRR | Source |
|---|---|---|
| Median B2B SaaS | 82% | ChartMogul, Dec 2025 (3,500 companies) |
| Top quartile B2B SaaS | 97% | ChartMogul, Dec 2025 |
| AI-native products above $250/month | ~85% | ChartMogul, Dec 2025 |
| Median bootstrapped SaaS, $3M – $20M ARR | ~104% | FE International / m3ter, 2026 |
| 90th percentile bootstrapped SaaS | ~118% | FE International / m3ter, 2026 |
| Median public SaaS | 110% – 115% | FE International, 2026 |
Read the spread rather than a single figure. The median private B2B product sits below 100%, which means its existing base shrinks slightly every year and growth depends entirely on new logos. Consumer and AI-native products run lower still, around 48% to 49% median, and only recover toward the mid-80s once pricing clears $250 a month.
There is a compounding reason to care: ChartMogul's analysis found that low-retention companies are roughly three times as likely to be shrinking as they are to be growing quickly.
How to use this calculator
- Enter the MRR your cohort started with. Use the recurring revenue those specific customers were paying when the period opened. The net revenue retention calculator needs the cohort defined first: one-time fees, services and brand new logos signed at the end of the period all stay out.
- Add expansion and reactivation revenue. Upsells, cross-sells, added seats and revenue from customers who came back inside the window. Reactivation is optional — leave it blank if your billing system does not report it.
- Subtract contraction and churn to read the net revenue retention formula result. Downgrades and cancellations come off the top. The net revenue retention calculator divides what remains by the starting MRR and returns NRR as a percentage, so you can see immediately whether the base grew or shrank.
- Compare NRR with the gross retention floor. The breakdown shows GRR next to NRR, which is the fastest way to see how much of a healthy headline is expansion quietly covering for a leaky base.
Frequently asked questions
How to calculate net revenue retention from MRR movements?
Divide the recurring revenue you still have from that cohort plus expansion and reactivation, minus contraction and churn, by the MRR the cohort started with, then multiply by 100. Customers who were not paying at the start of the period never enter the calculation, and the net revenue retention calculator above runs that arithmetic for you.
What is a good net revenue retention rate in 2026?
It depends on segment: median B2B SaaS sits near 82% with the top quartile near 97%, bootstrapped companies at $3M to $20M ARR median around 104%, and public SaaS companies run 110% to 115%. Anything above 100% means the existing base grows without a single new logo, and the net revenue retention calculator above shows where your own cohort sits.
Net revenue retention vs gross revenue retention: which one should you track?
Both. GRR shows how much the base leaks with expansion stripped out and can never pass 100%; NRR shows whether expansion covers that leak. A strong NRR on a weak GRR means upgrades are masking churn rather than fixing it.
Can NRR go above 100% without winning new customers?
Yes, and that is precisely what it measures. When expansion and reactivation from existing accounts beat contraction and churn, the base grows on its own. Every point above 100% is compounding revenue you did not have to buy, which is why NRR moves valuation so much.
Net revenue retention vs gross revenue retention
Net revenue retention vs gross revenue retention comes down to one question: do you count expansion? GRR removes it completely — (starting MRR − contraction − churn) ÷ starting MRR, capped at 100%. The worked example above gives 92%, meaning the base leaks eight points a year before a single customer upgrades. NRR adds expansion and reactivation back in, which is why it can exceed 100% while GRR never can.
Tracking only one of the two hides the mechanism underneath. A 109% NRR sitting on a 92% GRR is healthy but fragile: expansion is doing seventeen points of work to cover a leaky base, and if the upgrade engine stalls the headline falls straight back to 92%. That is also how to calculate net revenue retention the way finance teams do it — same cohort, same period, both metrics reported side by side so the reader can tell growth from retention.