Churn Rate Calculator
Churn rate is the share of customers you lose in a period: divide the customers who canceled by the customers you had at the start, then annualize the figure to see what retention really costs you.
Calculate your churn rate
Churn rate formula and a worked example
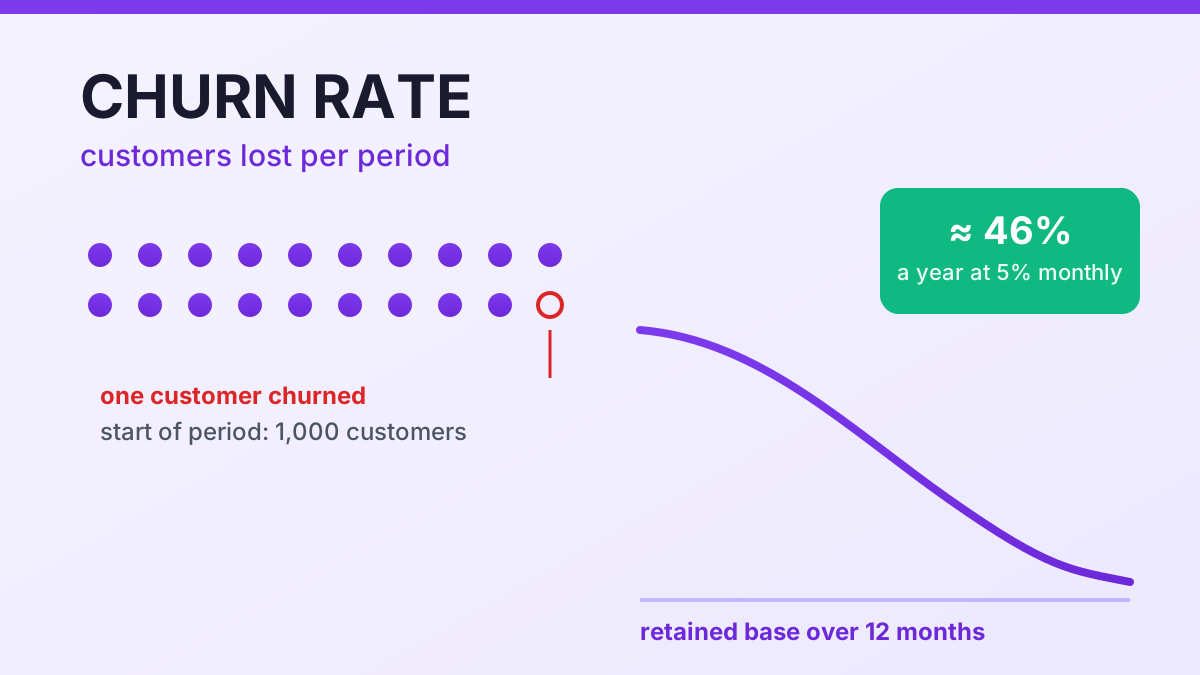
The customer churn rate formula is one division: customers lost during the period ÷ customers at the start of the period × 100. If 1,000 customers begin the month and 50 cancel, churn is (50 ÷ 1,000) × 100 = 5.0%.
Two things turn that number from decorative into useful. First, the window: the same formula applied to a quarter or a year produces rates that cannot be compared, so the period always travels with the result. Second, the annualized equivalent, because churn compounds against a shrinking base. A 5% monthly rate does not mean 60% a year — it means roughly 46%, since the customers already gone in month one have no chance to churn again in month nine.
The churn rate calculator above returns both figures at once, along with the average customer lifetime your current rate implies. Revenue moves with it too: add average revenue per customer and the tool shows the recurring revenue walking out of the door each period.
What is a good churn rate in 2026?
What is a good churn rate depends on your stage and segment — and on whether the benchmark you are reading is monthly or annual. Mixing the two windows is the most common benchmarking error in retention work.
| Segment (SaaS) | Median monthly customer churn | Best-in-class |
|---|---|---|
| Under $300K ARR | 6.5% | 1.5% |
| $300K – $1M ARR | 4.1% | 1.4% |
| $1M – $3M ARR | 3.7% | 1.3% |
| $3M – $8M ARR | 3.8% | 1.3% |
| $8M – $15M ARR | 3.1% | 1.5% |
| $15M – $30M ARR | 4.1% | 1.3% |
Those medians come from ChartMogul's SaaS benchmark data. Measured annually the same businesses look far healthier: Recurly's subscription-billing benchmarks report median annual churn of 3.6% across all industries, 3.04% for software, 3.21% for business and professional services and 4.25% for ecommerce subscriptions. Nothing contradicts anything — a 3% annual rate is simply the compounded result of a low monthly one.
The practical target is to move your monthly churn rate toward the best-in-class column for your revenue band, and to treat any rise above your own trailing average as a signal worth investigating before it compounds into the annual number.
How to use this calculator
- Enter the customers you started the period with. Add the count of active customers on the day the window opened. It is the denominator, so it must describe the same group of customers you are about to measure losses against.
- Add the customers you lost and the length of the period. Enter cancellations and non-renewals inside that window, then set the period length in months — 1 for a monthly figure, 12 for an annual one. The window is part of the result, not a detail.
- Read the rate and its annualized equivalent. The churn rate calculator returns your period rate plus the compounded twelve-month figure, so a monthly number can be compared with annual benchmarks without hand-rolling the math.
- Add average revenue to size the revenue at risk. Optionally add monthly revenue per customer and the tool converts lost customers into recurring revenue lost per period and per year — the number that decides how much new business you need to stand still.
Frequently asked questions
How to calculate churn rate across a full year?
Use the same formula with a twelve-month window, or annualize a shorter one by compounding: 1 − (1 − period rate)^(12 ÷ months). A 5% monthly rate becomes roughly 46% a year, which is why annual churn always looks far worse than the monthly figure suggests.
What is a good churn rate in 2026?
For SaaS, medians run from 3.1% to 6.5% per month depending on revenue band, with best-in-class near 1.3% to 1.5%. Measured annually, subscription benchmarks cluster around 3% to 4%. A good churn rate is one at or below the top quartile for your band and trending down, and the churn rate calculator above shows how far away you are.
Is the monthly churn rate simply the annual rate divided by twelve?
No. Churn compounds against a shrinking base, so a 46% annual rate is about 5% a month, not 3.8%. Dividing the annual figure by twelve systematically understates how much of your book leaves in a given month.
Does the customer churn rate formula change when you measure revenue?
Yes. Replace customers with recurring revenue: revenue churn = MRR lost ÷ starting MRR. That version is the more meaningful one when high-value accounts dominate, because losing a single large customer may barely register as logo churn while taking a big bite out of revenue.
Customer churn vs revenue churn
Customer churn counts logos; revenue churn counts dollars, and the two can tell opposite stories. If two enterprise accounts paying ten times your average leave, the customer count barely moves while a large slice of MRR disappears. Swap customers for recurring revenue in the customer churn rate formula and you get revenue churn — MRR lost ÷ starting MRR — which is the version your finance team watches.
The pair to read together is gross and net revenue churn. Gross churn counts only what was lost; net churn subtracts expansion and reactivation, so a business with negative net churn grows even with zero new customers — the same dynamic the NRR Calculator expresses as a retention rate above 100%. Churn also sets lifetime value directly: at a 5% monthly rate the average customer life is around 20 months, and each point shaved off churn stretches that horizon without a cent more acquisition spend.
Sources
- ChartMogul — Customer churn rate: definition, formula and monthly benchmarks by revenue band
- ChartMogul — SaaS metrics cheat sheet: monthly customer churn and best-in-class benchmarks by ARR band
- Recurly — Churn rate benchmarks: total, voluntary and involuntary churn by industry (July 2026 network data)
- ChartMogul — Revenue churn: net and gross MRR churn rate formulas