ACoS Calculator
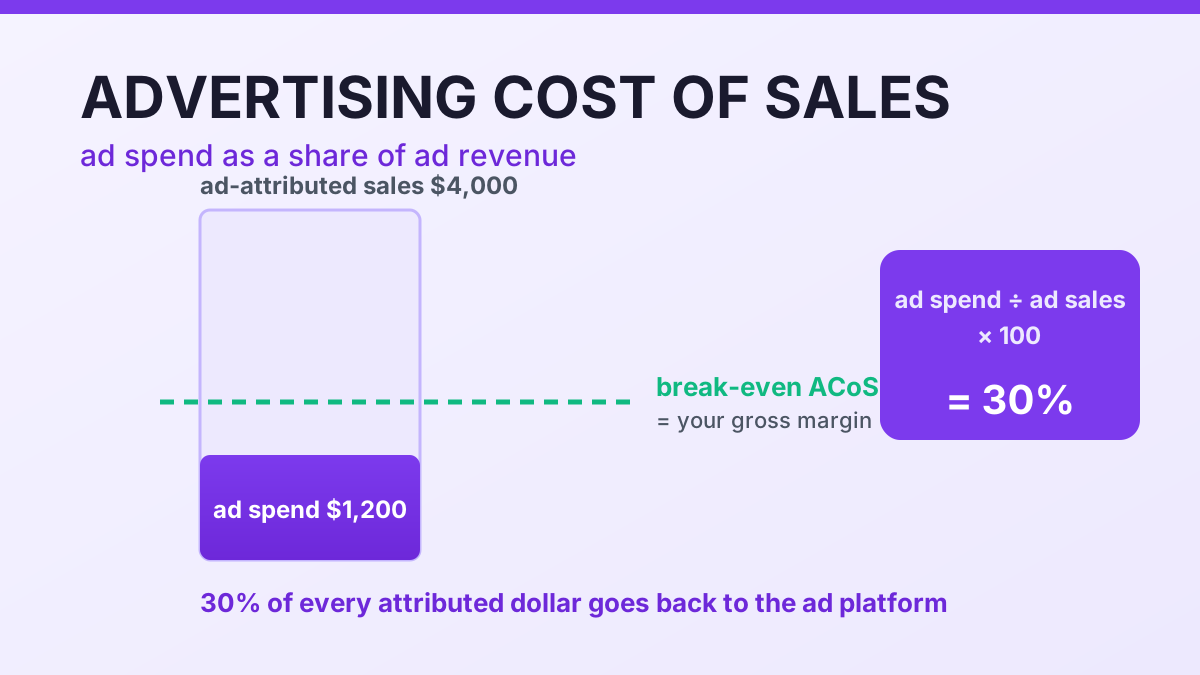
Advertising cost of sales is ad spend divided by ad-attributed sales: spend $1,200 to earn $4,000 and ACoS is 30%. Add your gross margin to see the break-even ACoS, or your total revenue to see TACoS for the same period.
Calculate your ACoS
How to calculate ACoS
Advertising cost of sales is ad spend divided by ad-attributed sales, expressed as a percentage. Amazon Ads states it the same way: if a campaign consumed $50 of spend and produced $100 of attributed sales, the ACoS is 50%. On $1,200 of spend against $4,000 of attributed sales, this ACoS calculator returns 30% — meaning 30 cents of every ad-attributed dollar went back to the platform as media cost.
Because ACoS and ROAS are reciprocals, always read them as one pair. A 30% ACoS is a 3.33x return on ad spend; a 20% ACoS is 5x. Whichever you prefer, the discipline is the same: hold the attribution window fixed (7-day and 14-day windows produce different revenue figures), decide whether returns and cancellations are netted out, and never compare a branded-campaign ACoS against a non-branded one. Branded terms usually convert at a fraction of the cost of discovery terms, so a blended number quietly averages a subsidy and a loss into a comfortable-looking middle.
What is a good ACoS in 2026
There is no universal answer, and the platform average is a starting point rather than a target. Ad Badger's 2026 benchmark set, built from app data through September 2026, puts the all-category ACoS at 29.6%, with category averages running from 19% in books to 42% in clothing and apparel. The spread is driven mostly by cost per click and conversion rate, not by discipline.
| Category | Average ACoS | Average CPC | Average CVR |
|---|---|---|---|
| Books | 19% | $0.38 | 18.0% |
| Food & Grocery | 21% | $0.58 | 16.5% |
| Beauty & Personal Care | 24% | $1.18 | 15.2% |
| Health & Household | 27% | $1.05 | 13.8% |
| Electronics | 29% | $1.45 | 9.5% |
| Clothing & Apparel | 42% | $0.72 | 8.6% |
| All categories | 29.6% | $1.22 | 11.1% |
Two lessons sit in that table. Cheap clicks with strong conversion — books, grocery — make a low ACoS possible; expensive clicks with weak conversion, as in apparel with its return rates, make a high one almost structural. Reading 42% in apparel as failure and 19% in books as excellence compares two different businesses, not two different skill levels.
The other variable is product stage. Launch campaigns routinely run far hotter than mature ones because they are buying rank and reviews, not margin, and a 2026 compilation of platform data puts mature, profit-focused accounts around 20% to 30% with a top decile between 15% and 23%. Judge a launch against a launch target and a mature campaign against margin, or you will kill a product in month two and celebrate one that never becomes profitable.
How to use this calculator
- Enter ad spend for the campaigns you are judging. Pull spend for one campaign set and one date range, not a blended account figure. Mixing branded and non-branded campaigns into a single number hides the campaign that is actually losing money.
- Apply the Amazon ACoS formula to your campaign totals. Add the sales the platform attributes to those same campaigns inside the same attribution window. Reported and attributed figures move when the window changes from 7 to 14 days, so keep it fixed between periods you intend to compare.
- Add margin to find your break-even ceiling. Gross margin is what makes ACoS interpretable: it is the highest percentage of revenue you can hand to the ad platform and still keep the sale. The breakdown returns that ceiling and the gross profit that survives after ad spend.
- Add total revenue to read TACoS alongside ACoS. With total store revenue for the same period the calculator derives TACoS. The gap between the two metrics shows how much of your sales are still paid for, which is the number that tells you whether advertising is building organic rank or renting it.
Frequently asked questions
How to calculate ACoS for a single campaign?
Divide that campaign's spend by the sales attributed to it in the same window, then multiply by 100. Spending $300 to generate $1,500 of attributed sales gives a 20% ACoS. Campaign-level numbers are the ones you can act on, so keep them separate from blended account figures.
What is the Amazon ACoS formula in plain terms?
ACoS = ad spend ÷ ad-attributed sales × 100, which is the exact inverse of ROAS = sales ÷ spend. A 25% ACoS is a 4x ROAS, and a 50% ACoS is 2x. Amazon Ads documents both formulas side by side because the two describe one campaign from opposite directions.
What is a good ACoS for a new product launch?
Higher than for a mature product, deliberately. Launch campaigns commonly run 30% to 60% while they buy rank and reviews, while mature campaigns usually target 20% to 30% depending on margin. The 2026 all-category benchmark of 29.6% sits in that range, with books at 19% and apparel at 42%.
What is my break even ACoS?
It equals your gross margin before advertising, less whatever contribution you want the ad-supported sale to leave behind. At a 50% margin and a 20% contribution target, the ceiling is 30%. Enter your margin above and the calculator returns that ceiling plus the gross profit remaining after ad spend.
Should I manage ACoS or TACoS?
Both, at different levels. ACoS is a campaign instrument: it tells you which keywords and ad groups pay for themselves. TACoS is an account instrument: by including organic revenue it shows whether advertising is compounding into rank. Set targets per campaign with ACoS, and judge the portfolio with TACoS.
Break-even ACoS, target ACoS and TACoS
Margin is the only honest ceiling. If a product carries a 45% gross margin before advertising, every point of ACoS above 45% is a sale you paid to make; below it, advertising is still contributing. So the break even ACoS for a product with a 50% margin and a 20% contribution target is 30% — the remaining 20 points are what covers overhead and profit. Amazon Ads frames the same idea as a target ACoS derived from margin rather than a generic industry number, and that is the version worth pasting into a campaign brief.
TACoS completes the picture by dividing ad spend by total revenue, organic sales included. For a healthy account it typically sits at roughly half of ACoS, and a 2026 vertical study puts profit-focused mature brands in the 8% to 12% TACoS band. The diagnostic value is in the direction of travel: a falling ACoS with a rising TACoS means paid sales are growing faster than organic ones, so you are renting volume rather than building rank. A rising ACoS with stable TACoS usually means ads are doing their job on a maturing catalogue.